Joining the 100 club (#webperf)
So a few months back we made a couple of changes to GOV.UK to improve frontend performance for all users. I’d been pushing to make this change for a number of months, but unfortunately changes in government tend to take quite a while. So although it was a fairly simple change, the impact it had on other GDS projects was noticeable. This increased the implementation timeline quite considerably. Since this change was made we’ve been looking to improve other areas of the website to make it even faster. In doing so I’ve been doing a lot of reading and experimenting with web performance. That got me thinking “I wonder how well my website performs?”.
Initial results
I used an excellent tool called Google Lighthouse that is built into Chrome to check the overall performance of the site. The initial results were good, but not perfect. The tests were conducted on the default Lighthouse settings for mobile with “Applied Fast 3G, 4x CPU Slowdown” selected. You can see the full results from the audit here.
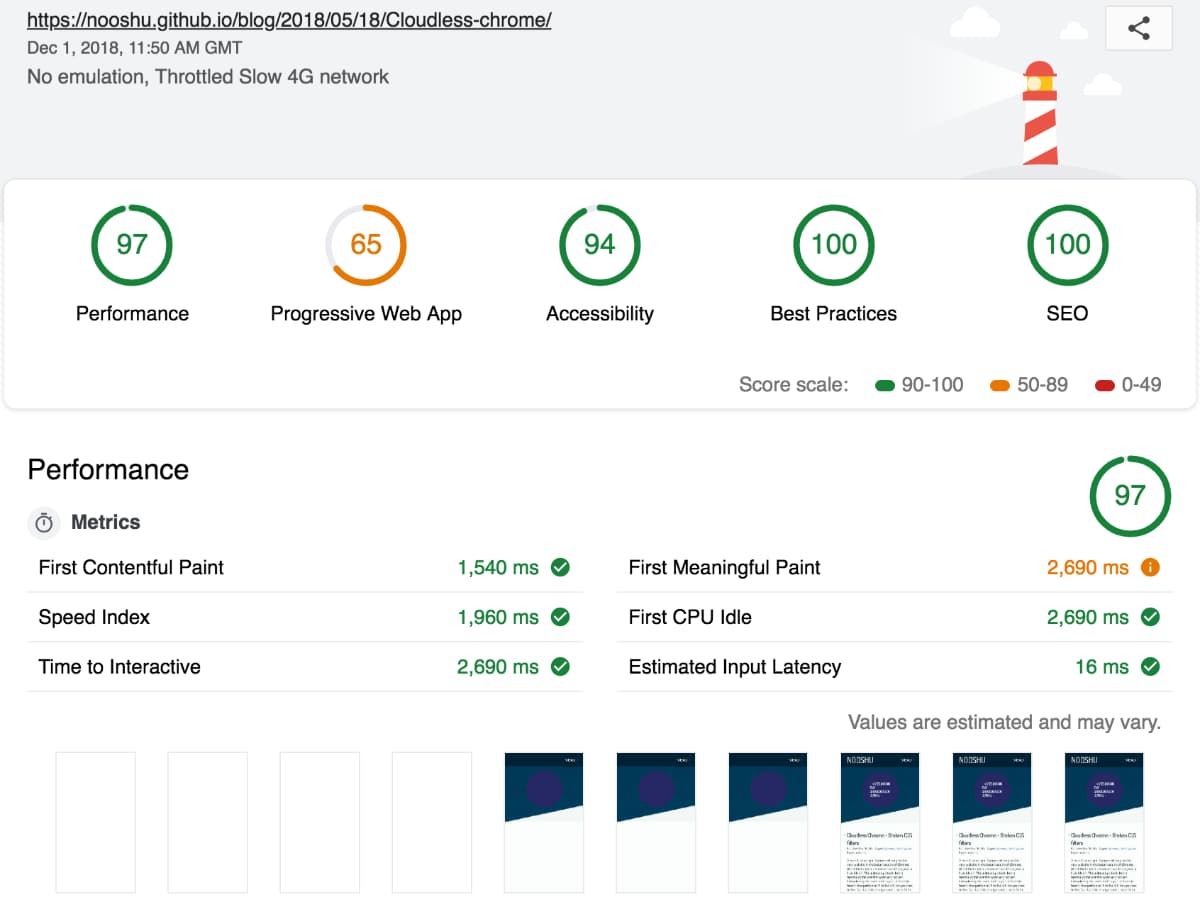
As you can see the score was 97 out of 100. It’s a decent score, but where were the last 3 points being lost? Well there’s a handy Google sheet called ‘Lighthouse Score Weighting’ that you can examine. It tells you what you should be scoring for each performance metric to achieve a certain percentage:
- First Contentful Paint
- First Meaningful Paint
- Speed Index
- First CPU Idle
- Time to Interactive
A comparison between the two sets of data showed there was a fair bit of improvement needed to hit 100. Time to look at the network tab and run an audit on Web Page Test.
What were the issues?
From the audit run on Web Page Test it was easy to spot where some improvements could be made. The results shown were run on an iPhone 5c on a 4G connection. Not the most up-to-date handset, but still one that is very popular.
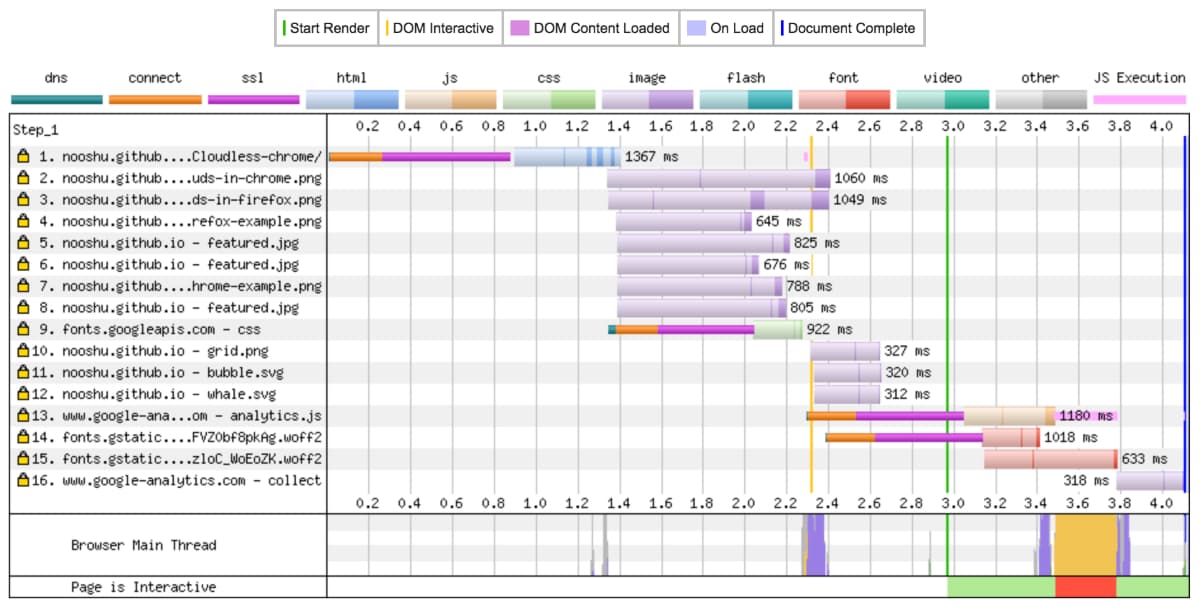
On the graph you can see some green, orange and purple bands. This is DNS lookup, connection established and SSL negotiation. Each of these is taking 800ms. Now that doesn’t sound like much, but in web performance terms that is huge! Each of these lookups was for a Google service: Analytics and Google Fonts. As I want to monitor the analytics data, there’s not much I can do about that. For the fonts there are certainly optimisations that can be made.
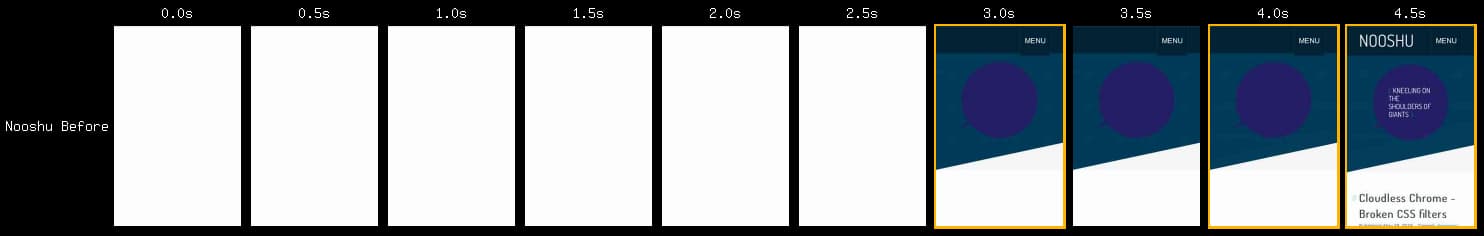
The filmstrip view from Web Page Test really highlights the main issue. Notice how 3 seconds into loading we have the background colours but no text. At this point the font hasn’t been downloaded and what we are seeing is a Flash of Invisible Text (FOIT). This will be killing the First Meaningful Paint (FMP) score which measures when a user perceives that the primary content of a page is visible. It’s easy to see why this is all happening when you combine the waterfall graph with the filmstrip. The fonts are being hosted on a 3rd party website, so there will be a separate set of connection negotiation and round trip time associated with the font download. Time to eliminate these issues. The full Web Page Test report can be seen here.
What did I change?
Eliminate the 3rd-party hosting (Google Fonts)
Is it possible? Sure it is. Thankfully there is a really helpful tool to allow you to do this easily, google-webfonts-helper. Select the font you want to self-host, download and away you go. Place the files on the same server as your main website so you are no longer dependant on a 3rd party for your fonts.
Remove unneeded fonts, swap for a system font
Did I really need the second webfont for the main content? In using two Google Fonts, this is doubling up on the number of fonts to download and also the associated CSS. More bytes to download equals slower performance. So I swapped the main content font to Geneva, as it is very similar to what I had before. Now the browser can use a locally installed font rather than having to download the second font.
Control the way fonts are displayed while loading
How can we control the way the font loads? Well there’s a CSS property for that font-display. At the moment browser support isn’t perfect, but it is getting there. This setting allows a developer to control the block, swap and failure period when loading. I’ve chosen to use font-display: swap;. What this does is:
- There’s no block period, so before the custom font is loaded the fallback font is displayed
- Once the font is downloaded, the fallback will be swapped for the custom font. There is an infinite period in which this can happen.
- Downside to this setting, you could potentially see Flash of Unstyled Text (FOUT)
So why don’t Google Fonts use this setting by default? Why can it only be applied when you self-host the fonts? Well there’s a really long thread discussing just that if you are interested.
Minimise the chance of FOUT
Is it possible to minimise the likelihood of the FOUT? Yes, and it is super simple to implement. What is needed is the preload link element in the <head> tag. This allows a developer to tell the browser about critical assets that will need to be downloaded in the future. By telling the browser ahead of time that the font will be required, it should therefore be downloaded by the time it is actually required on the page. If the font is already in the cache, no FOUT!
<link rel="preload" href="/assets/font.woff2" as="font" type="font/woff2">
It is worth checking out the browser support for this feature, as it is still quite new. And a word of warning about its usage: use it sparingly for assets you know the page absolutely needs. The preloaded asset will be bumped to the highest priority in the queue. It will be prioritised even higher than CSS. So if you preload a lot of files, you’ve just added a large number of render blocking bytes to the critical path!
I’ve run a couple of tests on WPT and compared them if you’d like to see the difference preload can make on supporting browsers. iPhone 5 SE on a 4G connection visually completes 500ms quicker with preload!
The full specification for preload can be found here, along with the section related to fetching critical assets.
Final results
Well I’m happy to report that I managed to join the “100 club”! A completely made up club for people who’s website scores 100/100 for performance in Lighthouse. Silliness aside, the results were really impressive considering how little work it required. The full audit for the after performance can be viewed here.

The key metrics were all reduced by the following amounts:
- First Contentful Paint: 630ms
- First Meaningful Paint: 1,780ms
- Speed Index: 810ms
- First CPU Idle: 460ms
- Time to Interactive: 460ms
That’s an incredible increase in performance, especially around the First Meaningful Paint (when the primary content is visible to the user). Almost 1.8 seconds quicker!
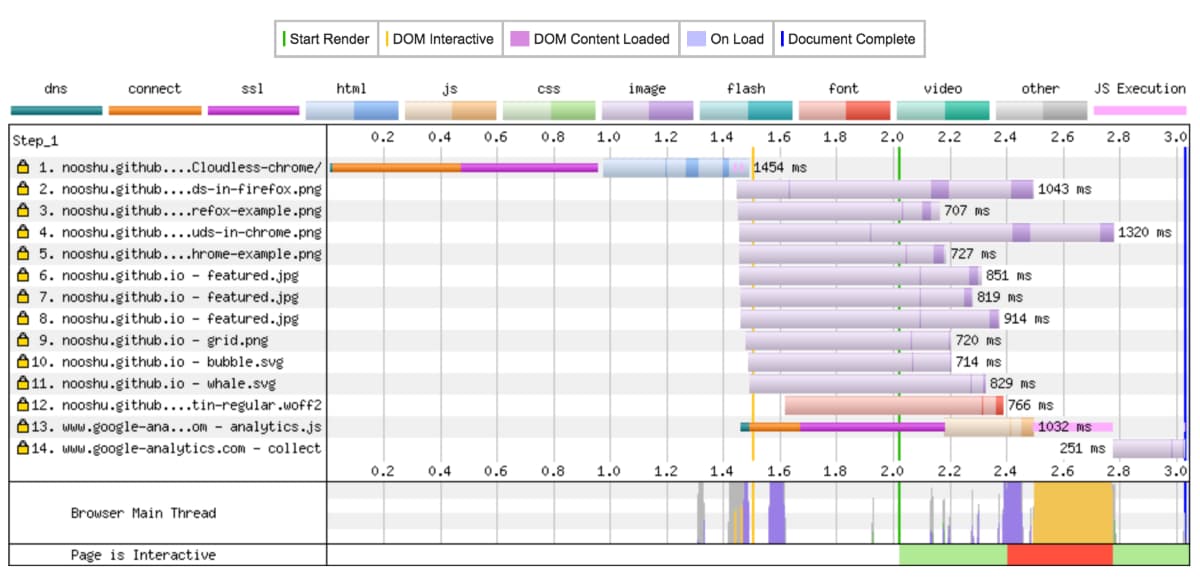
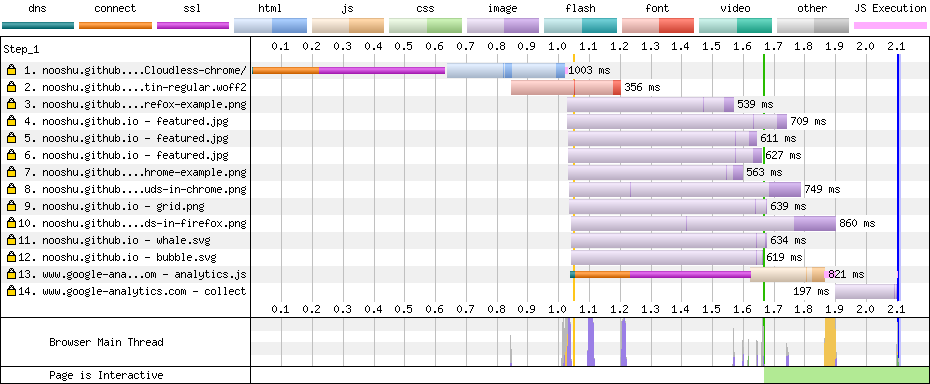
The changes can really be seen in the waterfall graph. Notice how there are only 2 DNS/Connect/SSL negotiations in this graph (there were 4 before the changes were made). The font is downloaded immediately since the initial connection negotiation to the main domain has already been established.
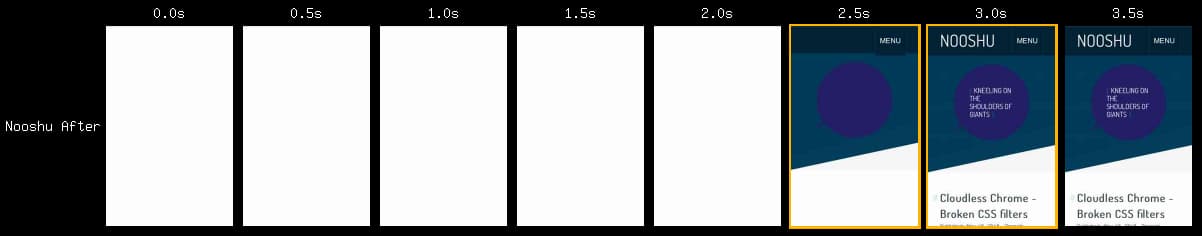
Overall page load time and the number of panels without main content have been reduced. The perceived performance of the site has been greatly improved for users. The full Web Page Test report can be seen here.
Web Page Test actually comes with a really handy feature. You can compare multiple results on the same page, allowing you to see exactly what has changed. Here’s a comparison of the before and after audits.
Conclusion
By using freely available performance tools like Lighthouse and Web Page Test, it is possible to easily identify performance bottleneck’s in your website’s frontend code. Solving those performance issues once identified can sometimes a more difficult task. Thankfully the optimisation of webfont performance has been a high priority for browser vendors over the past few years. We as developers have been given tools that can make a real difference in web performance. This should making the web faster for all users as they become more widely adopted.
