Using jq with the WebPageTest API
I’ve written quite a few blog posts on this blog about WebPageTest (WPT). The reason for this is it tends to be the first tool I (and I’m sure many) look to when they want to debug web performance issues with a website. Underneath its retro looking user interface (UI) is an incredibly powerful data collection tool for you to examine and analyse. Now what you may not realise is that all the data you can see in the UI, is also available via the WebPageTest API.
Update: All the jq scripts from this post can be found in this wpt-jq-data-scripts repo, along with a link to the example graphs in Google Sheets that can be found here.
Accessing the API
Accessing the API is very simple. You can either enter the URL https://www.webpagetest.org/jsonResult.php?test=[TESTID] in your browser, or follow the ‘View JSON result’ link on a tests summary page (see below):
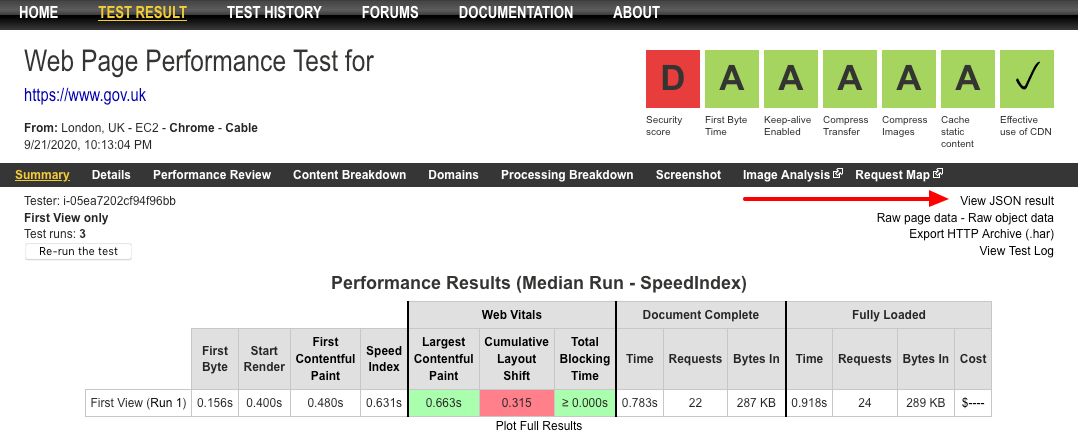
Follow this link in Firefox and you will get a loverly inbuilt JSON viewer with a filter tool to quickly find what you are looking for. But if you happen to be a Chrome user you’re out of luck, as you will simply get the raw JSON output on the screen. But there are JSON formatter extensions on the Chrome Web Store you can install should you want this functionality.
The JSON blob
So what comes out of the API in terms of data, and how much data are we talking about? Frankly it’s a lot of data! The JSON blob contains detailed information about every single test run, and all of the individual file requests (including cookie and header information) for each run too. So you can imagine that as the number of runs increases (to give you a more stable median), the file size increases dramatically. For example, a single test run using Chrome for the homepage of this blog produces a JSON blob that is approximately 520KB in size (uncompressed / unminified). Taking it to the other extreme, with the GDS private instance of WebPageTest I’ve run a number of tests with 200+ test runs. The JSON blob from these tests is around 50 MB (uncompressed / unminified). So if you are looking for a great way to stress test your JSON viewer or parser, the WebPageTest API is an excellent way to do it!
Bringing in jq
So the output from the WebPageTest API can be pretty huge. Packed full of interesting data waiting to be analysed and explored. But how do you do that in a quick and easy way? That’s where jq comes in. So what is jq? I think the jq author Stephen Dolan explains it best:
jq is like
sedfor JSON data - you can use it to slice and filter and map and transform structured data with the same ease thatsed,awk,grepand friends let you play with text.
Basically jq is an incredibly powerful tool for manipulating JSON data. It can be used to extract basic data, or even fully restructure it if required. When I say it is a tool, that’s actually doing it a huge disservice. jq is in fact a Turing Complete programming language. Proof of its turing completeness can be seen here, with a Brainfuck interpreter written in jq.
So how can we use jq with the WebPageTest API to simplify our workflow and extract that data we need? That’s what the rest of this blog post will be talking about.
The basics
So first, the absolute basics. For readers who already have experience using jq, you can probably skip this part. But I’m always one for being inclusive and covering first principles in blog posts. Downloading / installing is fairly simple, and there are plenty of ports available with instructions on the download page. Once installed we can use curl to grab our JSON blob like so:
curl -s https://www.webpagetest.org/jsonResult.php?test=[WPT_TEST_ID] > test-data.json
Here we are saving our test data to a test-data.json file on the local machine. Once done, we can read it using jq:
jq '.' test-data.json
This command will print the whole contents of the JSON file to the screen. The '.' is known as the identity filter. It takes the input, and pipes it directly through to the output. This is an excellent way to pretty print a set of JSON data:
jq '.' test-data.json > pretty-test-data.json
The above method works, but it’s very long-winded. Thankfully jq has the ability to either read a file, or it can take its input from stdin. So the above commands can be simplified to:
curl -s https://www.webpagetest.org/jsonResult.php?test=[WPT_TEST_ID] | jq '.' > pretty-test-data.json
Here we are passing the output from the (silenced with -s) curl command into jq. jq is then pretty printing it to a file on the computer.
The above commands are the basis for the rest of the commands listed in this post.
What data is in the API
So let’s assume we don’t have a JSON viewer to dig down into the data. So what can we do to help us understand what data the API contains? There are a couple of jq commands that can do that:
# query the API, pipe into `jq`
curl -s https://www.webpagetest.org/jsonResult.php?test=[WPT_TEST_ID] | jq -r '.data | path(..) | map(tostring) | join ("/")' > full-schema.txt

# example output
fvonly
successfulFVRuns
average
average/firstView
average/firstView/minify_total
average/firstView/responses_200
average/firstView/testStartOffset
average/firstView/bytesOut
average/firstView/gzip_savings
average/firstView/requestsFull
average/firstView/start_epoch
average/firstView/cpu.MarkLoad
average/firstView/connections
average/firstView/cpu.EventDispatch
...
Examining this filter:
.data- navigate down into the data objectpath(..)- recursively decent into the large structure and extracting all the pathsmap(tostring)- map the array into a new array and convert paths to stringsjoin ("/")- join each string together with a forward slash
We then output this result to a file. What this has now created is a high-level schema as to how the WebPageTest API is structured. If you are interested in the full output of this command you can find the Gist here.
Top level structure
Examining the API closely a pattern emerges. At the top level you have some basic test run data and a set of objects with (much) more data:
- average - contains data about the average for each metric across all runs
- standardDeviation - contains data about the standard deviation of each metric across all runs
- median - contains data about the median run (depending on median metric that has been selected)
Delving a level deeper we find each of these has the following:
- firstView - data from the first view of the page
- repeatView (if selected in the GUI) - data from the repeat view of the page (useful for examining caching between page navigation)
And within each of these we come to a huge amount of data that WebPageTest has gathered from the selected browser when loading the page. And this same data structure can be found within each of the runs objects at the top level:
- runs - each of the individual run data is contained within here
- runs/1 - data about run 1
- runs/2 - data about run 2
- runs/n - data about run n…
Inner data structure
We can use another jq filter to extract information about the inner data structure within the average, standardDeviation, median, and individual run numbers:
jq -r '.data.median.firstView | to_entries | def parse_entry: {"key": .key, "value": .value | type}; map(parse_entry) | sort_by(.key) | from_entries' > inner-structure.json

# example output
{
  "Colordepth": "number",
  "Dpi": "string",
  "Images": "string",
  "LastInteractive": "number",
  "LayoutShifts": "array",
  ...
}
Examining this filter:
.data.median.firstView- navigate down into the median firstView datato_entries- convert an object into an array of objects with a key and a valuedef parse_entry- define a jq function to rewrite the object into key then examine the type of value it ismap(parse_entry)- create a new array, running each object through this functionsort_by(.key)- sort result alphabetically by the key namefrom_entries- convert the array back into an object
Then we output the final modified JSON to a file to be used where needed. The full output of this command can be seen in this Gist here.
Problematic keys
Update: So Pat Meenan has come to the rescue (again) and quickly solved this issue. If you append normalizekeys=1 to a JSON response, the key names will now be normaized, stripping away any non-alphanumeric characters. For the API this means any ., -, and _ characters will be removed. I’m leaving in the section below for future reference.
It’s worth mentioning at this point that the naming of some of the keys coming from the API can be problematic depending on how they are being used. There are many keys that contain a . which may not sound too bad, but if you are extracting the data using JavaScript, it causes issues. For example, to access values in a JavaScript object you may often use the dot notation:
var simple_example = {
	"connectivity": "Cable",
	"loadTime": 887,
	"firstImagePaint": 627
}

// Accessing values
simple_example.connectivity // "Cable"
simple_example.firstImagePaint // 627
But look what happens when one of our keys contains dots:
var simple_example = {
	"connectivity": "Cable",
	"loadTime": 887,
	"firstImagePaint": 627,
	"cpu.v8.compile": 21
}

// Accessing values
simple_example.cpu.v8.compile // "cpu is undefined"
The JavaScript is looking inside the simple_example object and looking for the cpu object, then for the v8 object, until it finds the compile key. Obviously this chain doesn’t exist as cpu.v8.compile is a single key name, so the JavaScript fails.
There are also another set of keys that can cause issues too: some of the keys include - in the name. This is again an issue when using the dot notation to try to extract the value. The presence of - in the key is seen as a subtraction expression, e.g. data.median.firstView.score_keep-alive is seen as data.median.firstView.score_keep - alive, which of course fails. There is a fix for this issue in JavaScript. You can use the array syntax to look up the values:
var simple_example = {
	"score_keep-alive": 1,
	"cpu.v8.compile": 21
}

// Accessing values
simple_example['score_keep-alive'] // 1
simple_example['cpu.v8.compile'] // 21
But wouldn’t it be great if we could get jq to clean the data for us, so we don’t need to even worry about it? Thankfully we can with this filter:
jq 'walk( if type == "object" then with_entries( if .key | contains("-") then .key |= sub("-";"") else . end) else . end) | walk( if type == "object" then with_entries( if .key | contains(".") then .key |= gsub("\\.";"") else . end) else . end)'
It’s a bit of a beast, but it is basically walking through the data examining the keys. If they contain a - or a . then it is replaced with nothing.
NOTE: This isn’t the most efficient filter since it is walking through the data twice. If anyone has any pointers on how to reduce this down to a single walk() function call, please let me know.
Scenarios
Now that we’ve taken a closer look at the data available inside the API, let’s look at a few jq commands we can run to extract the data we want.
Extracting first and third party domains
This isn’t as hard as it sounds since the API returns a domains object with each domain visited in the test and some connection information about the domain too. Using jq we can easily extract a list of all the domains. Note the use of the --raw-output option (or -r), which stops the resulting output being formatted as JSON. In this example we don’t want quoted strings, we want them as a simple list.
jq -r '.data.median.firstView.domains | to_entries[] | .key' > domains-list.txt
Or if you only wanted first-party domains (assuming ‘nytimes.com’ is the website being tested):
jq -r '.data.median.firstView.domains | to_entries[] | select(.key | contains("nytimes.com") ) | .key' > first-party-domains-list.txt
Or what about the inverse, if you wanted all third-party domains:
jq -r '.data.median.firstView.domains | to_entries[] | select(.key | contains("nytimes.com") | not ) | .key' > third-party-domains-list.txt
So where might this be useful? Well WebPageTest has the ability to block requests to certain domains, so you could quickly block any / all third-party domains by copy / pasting the result of this command into the GUI. If you are wanting to block all third-party requests there’s an easier way using WebPageTest scripting (blockDomainsExcept) that Andy Davies covers in his ‘Measuring the Impact of 3rd-Party Tags With WebPageTest’ blog post. But this method gives you a way to gradually add / remove domains from the list and retest the impact of each if required.
Plotting connection setup metrics across runs
Here we’ll look at plotting the values from a large number of test runs related to the connection setup time (similar to the graphs I created in this blog post). So we are looking for the following values from the API:
- DNS start & end (
runs.number.firstView.requests.0.dns_start,runs.number.firstView.requests.0.dns_end) - Connect start & end (
runs.number.firstView.requests.0.connect_start,runs.number.firstView.requests.0.connect_end) - SSL start & end (
runs.number.firstView.requests.0.ssl_start,runs.number.firstView.requests.0.ssl_end)
Note: I realise the API comes with dns_ms, connect_ms, ssl_ms, but in the tests I’m looking at there are a lot of 0 values for this key, so I will calculate it manually.
Our plan here is to extract only the data listed above and output into a comma-separated values (CSV) format. That way we can easily import the data into any graphing tool and graph the data. Here’s the command for this (version 1):
jq -r '["DNS Start", "DNS End", "Connect Start", "Connect End", "SSL Start", "SSL End"],(.data.runs | to_entries[].value.firstView.requests[] | select(.final_base_page == true) | [.dns_start, .dns_end, .connect_start, .connect_end, .ssl_start, .ssl_end]) | @csv' > csv-output.csv
This is a long command, so let’s break it down a little:
["DNS Start", "DNS End", "Connect Start", "Connect End", "SSL Start", "SSL End"]- these are the headers for each of the columns in the resulting CSV file.data.runs | to_entries[].value.firstView.requests[]- drill down into the runs data and convert each run into a set of data objects with a key and a value (and remove them from the wrapping array). Then pull out the runs individual requests from the first view and unwrap from the array.select(.final_base_page == true)- here we are filtering to find the request that has come from the HTML of the page (that will contain the connection information we need)[.dns_start, .dns_end, .connect_start, .connect_end, .ssl_start, .ssl_end]- construct a new array only containing the data we will need in the CSV file| @csv- pipe the final array wrapped data into the CSV formatter> csv-output.csv- output to a file
This gives us a CSV file with 6 columns, and from those columns we can calculate the time each of the DNS, Connect, SSL stages took. But we can actually get jq to do that calculation for us:
jq -r '["DNS", "Connect", "SSL"],(.data.runs | to_entries[].value.firstView.requests[] | select(.final_base_page == true) | [(.dns_end - .dns_start), (.connect_end - .connect_start), (.ssl_end - .ssl_start)]) | @csv' > csv-output.csv
The above command is very similar to version 1, only now we have got jq to do some of the calculation leg work for us, as it can do the basic arithmetic when the new array of data is being constructed. So no need to do it in our spreadsheet / graphing tool now.
It’s worth mentioning that we’ve just reduced a 46MB JSON file with 201 test runs down to a 2KB CSV file by discarding all the information we weren’t interested in.
Importing the data into Google Sheets, it is now possible to create a graph that look like this:
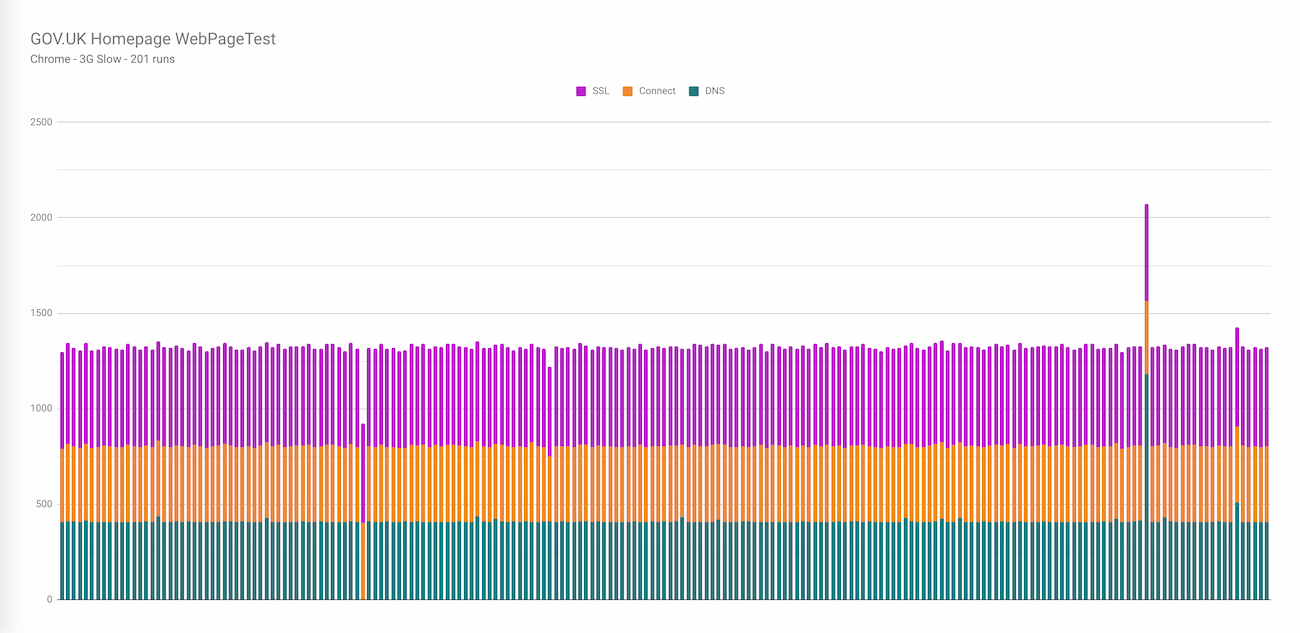
Now I don’t know about you, but the thought of having to type out those 289 characters to run that command doesn’t sound like much fun. So let’s look at how we can simplify the workflow.
jq command reuse
There’s a really useful bit of functionality where jq can be used in a shebang line. Using this method it is possible to hide the jq code inside a separate file, then point your JSON at the file and out pops the data in the format we need! So if we take the complicated looking filter above, and create a connection-metrics.jq file (gist here):
#!/usr/bin/env jq -rMf

# Filter to extract DNS, Connect, SSL metrics from WebPageTest run JSON

# Headers for resulting CSV
["DNS", "Connect", "SSL"],
	# drill down into the runs data
	(
	.data.runs
	# convert the run data into an object and drill down into the run request data
	| to_entries[].value.firstView.requests[]
	# only select the request that corresponds to the HTML page (so it has DNS,Connect,SSL data)
	| select(.final_base_page == true)
	# build an array of the resulting data we want in the CSV
	| [(.dns_end - .dns_start), (.connect_end - .connect_start), (.ssl_end - .ssl_start)]
	)
	# pass to the CSV formatter
	| @csv
Notice how we can now easily comment the filter and split it over multiple lines for better readability. Save this to a file, make sure the file can be executed (chmod +x connection-metrics.jq), then point it at your WebPageTest JSON like so:
curl -s https://www.webpagetest.org/jsonResult.php?test=[WPT_TEST_ID] | ./connection-metrics.jq > result-output.csv
or for a JSON file on your local machine:
./connection-metrics.jq wpt-api-input.json > result-output.csv
Both of these commands produce a CSV output like below, that can be easily imported into any program that happens to support CSV’s.
"DNS","Connect","SSL"
37,29,45
32,30,45
33,29,45
...
Use as a template
So the great thing about the above example is it can now be used as a template for extracting other values from each of the WebPageTest runs. The command has already drilled down to the run level data after all. So what about if we extract and plot some other metrics? For example lets look at:
- Time to First Byte (
TTFB) - First Contentful Paint (
firstContentfulPaint) - Start Render (
render) - DOM Complete (
domComplete) - Fully Loaded (
fullyLoaded)
We modify the above example script to find the new metrics (seen in this gist), then run it over our data set. This then gives us a graph that looks like this:
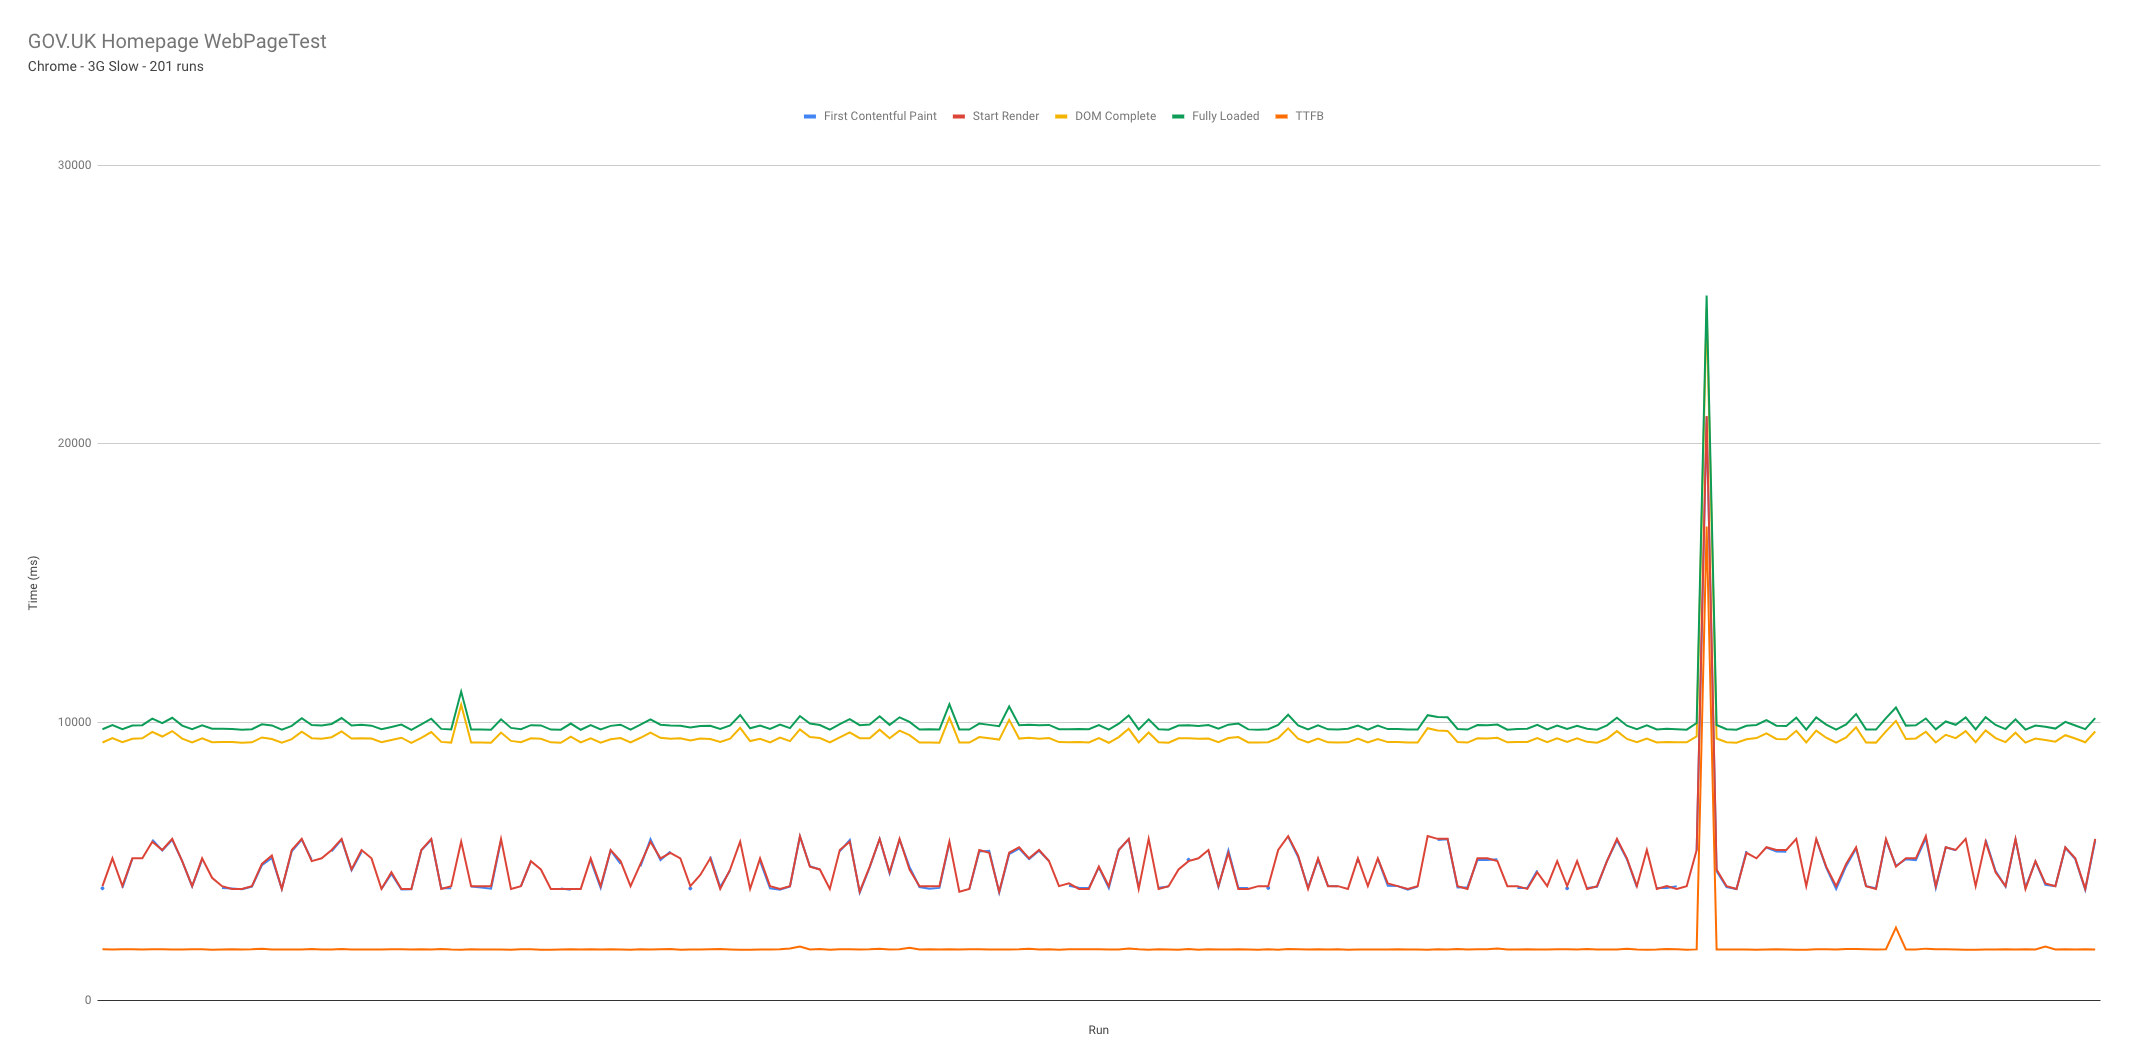
So over the 201 test runs it’s clear to see that the TTFB was very stable, with DOM Complete and Fully loaded second in terms of stability. FCP and start render are almost identical and jump around a lot. But there’s an issue: there’s a huge spike in the results which is clearly an error, and it breaks the scale of the graph. Now of course we could look through all of the data manually and remove it, but lets get jq to do it for us. After all if we ever had a data set with lots of these occurrences, automating the task is going to save us time.
First we need to find a way to pinpoint the broken test run. The most stable metric is TTFB, which we have a fairly good idea about what this value should be (~2000ms), so we can use it to filter out any large differences from the data. To do this we simply add a | select(.TTFB < 2200) into the filter. With this we are only allowing run results through that have a TTFB of less than 2.2 seconds. Here’s an updated gist with the minor code changes.
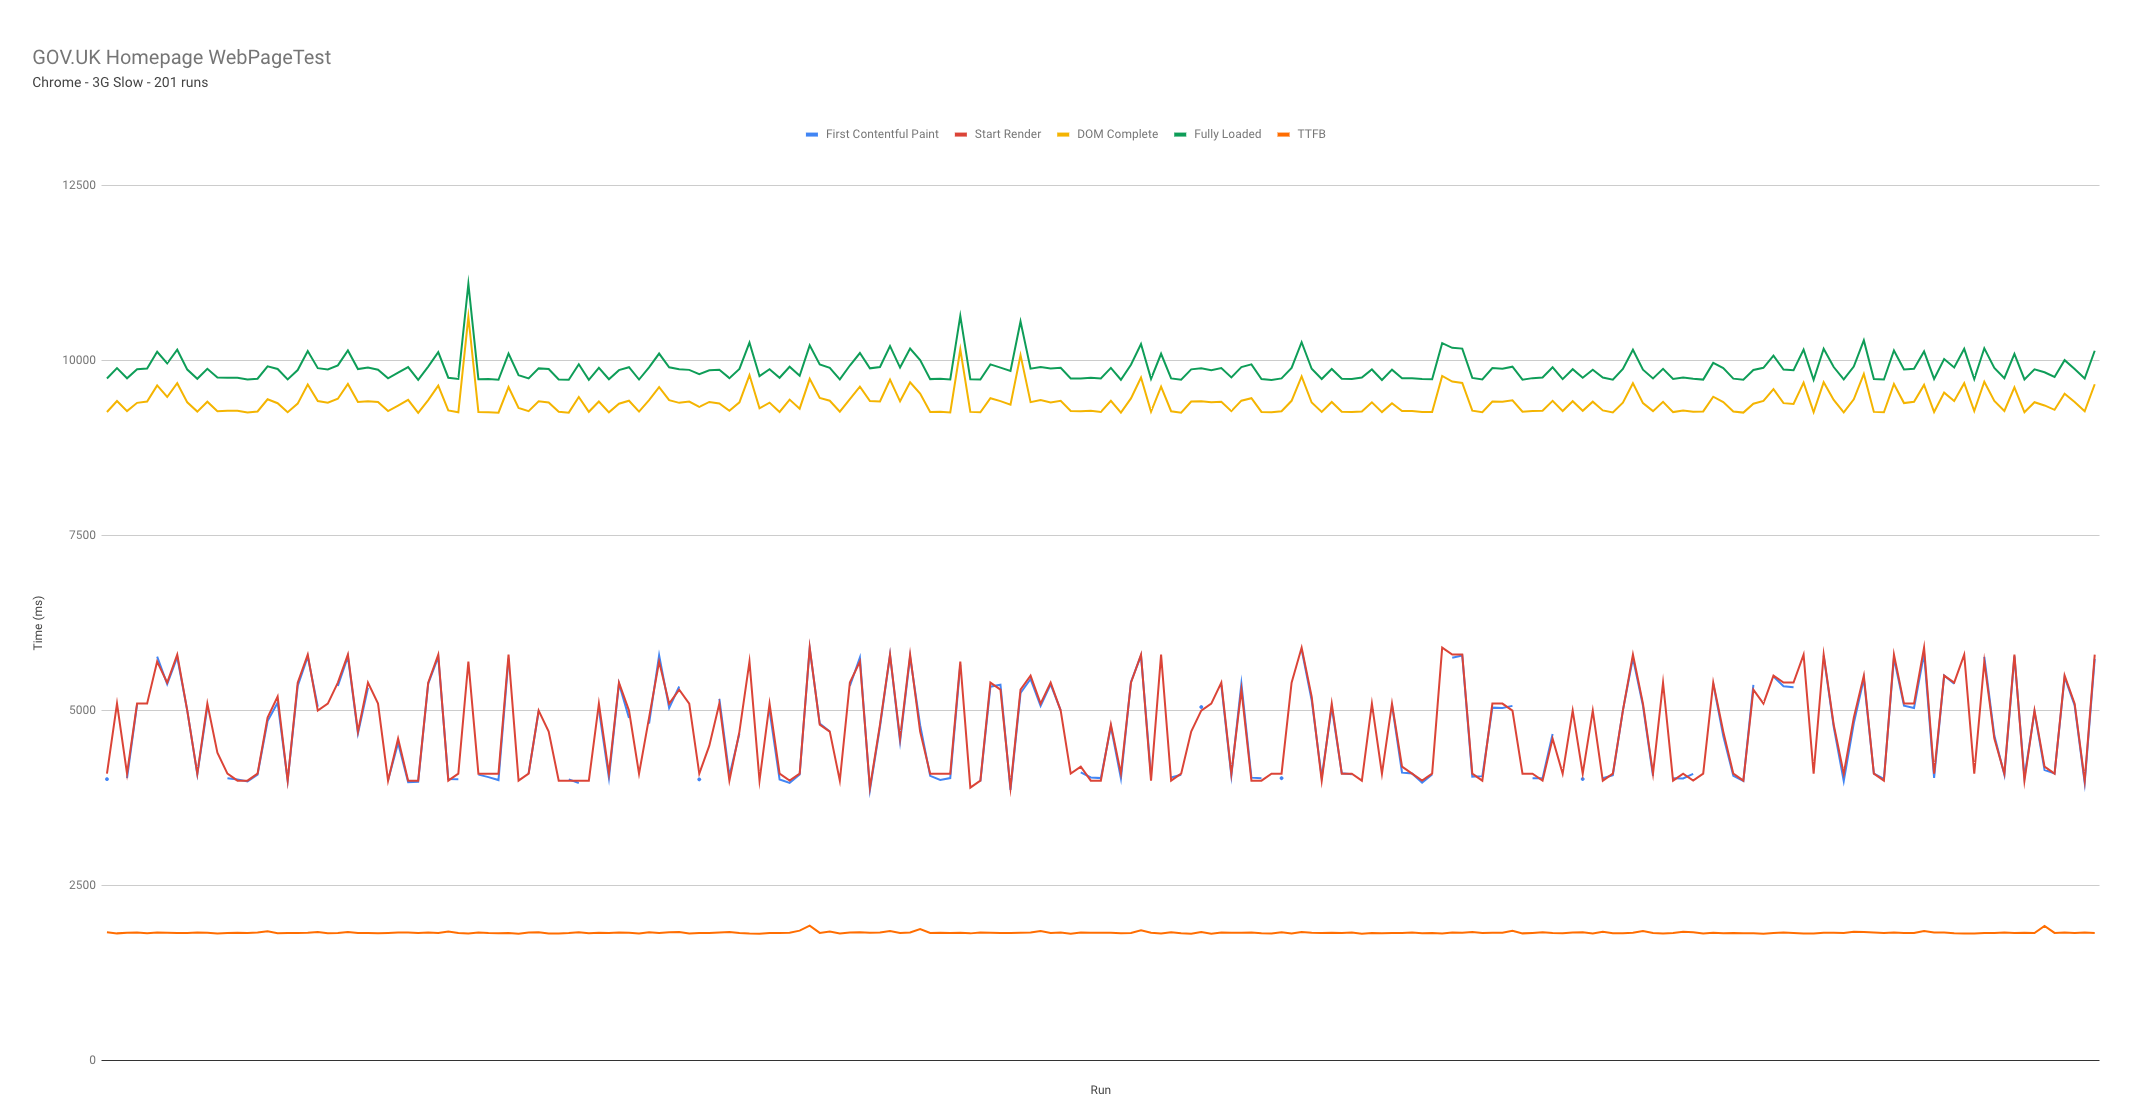
As you can see from the graph above, the vertical axis is a lot more applicable to our overall results, thus giving us a better idea of how the metrics fluctuate over time.
Examining CLS information
There’s been a lot of talk recently about Cumulative Layout Shifts (CLS), since it is now considered part of Googles Core Web Vitals. In the future a poor CLS result could actually hurt your search engine page rank (at least with Google). Thankfully WebPageTest monitors a page for layout shifts and gives detailed information about when they happen and the score for each shift. We can use this information to plot the layout shifts for each run, and see how they vary between them:
jq -r '.data.runs | to_entries[].value.firstView | [.LayoutShifts[].score] | @csv' > cls-scores.csv
This is a relatively simple filter:
.data.runs | to_entries[].value.firstView- drill down into the runs data and convert each run into a set of data objects with a key and a value (and remove from the array). Then extract the runs first view data.[.LayoutShifts[].score]- look at all the layout shift information, unwrap from the array and pull out each score, wrap in an array for the CSV formatting (CSV’s require an array an an input)@csv- pipe the final array wrapped data into the CSV formatter> cls-scores.csv- output to a file
Plotting this data in Google Sheets gives you a graph that looks like this:
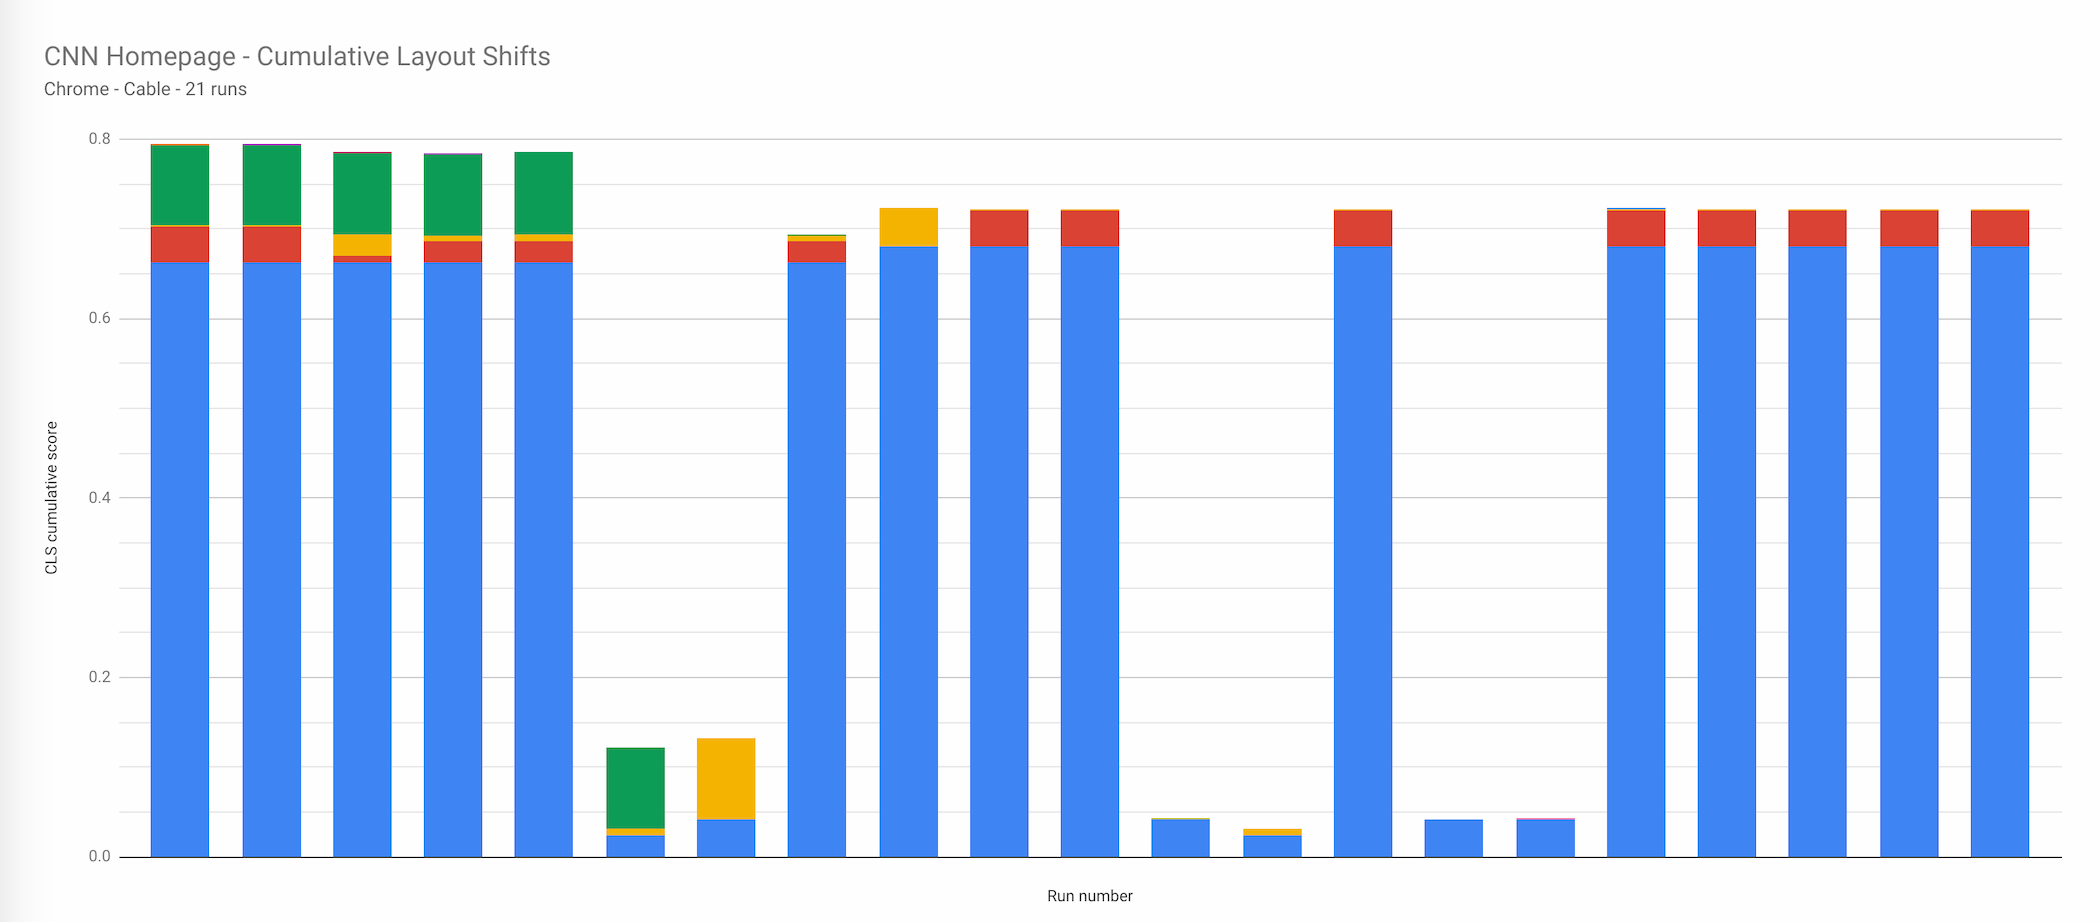
The site tested above is the old web performance community favorite: CNN.com. 21 runs using Chrome on a cable connection. Each column on the x-axis shows an individual run. The y-axis shows the cumulative CLS score for that run. Each of the colours is a separate ‘shift’ that occurred during page load. What strikes me about this graph is the difference between each of the runs, with the lowest cumulative score of around 0.04, and the highest just under 0.8! If Google is going to be factoring CLS into search rankings (presumably from user RUM data), I’d personally want this score to be a little more stable!
This graph could be used by a team as a prioritisation exercise. The blue column is large and prominent in each of the runs, so this would be worth investigating as a priority to see if this shift can be reduced.
More examples to follow…
As I come up with other examples of data to extract from the API using jq, I will post them here. If you have a handy jq snippet you are willing to share please do let me know, full credit will be given to you.
Tools to help manipulate JSON data with jq
So how do you manipulate megabytes of JSON data quickly? Because, I have to be honest there’s a lot of trial and error with jq (at least for me). Oftentimes what I think will happen with a particular filter, doesn’t. So the ability to tweak filters and see the result quickly is key to using jq. And as a VS Code user there are a number of extensions available to optimise jq workflows. The fact that WebPageTest outputs such large JSON blobs makes it quite a resource intensive use case for these extensions. So let’s examine how well they work.
Visual Code jq playground
Visual Code jq playground is the most feature complete extension of the three that I’ve looked at. It has great documentation and examples, and also has the ability to show the results in an editor window or the ‘Output’ tab. It managed to return the manipulated results from a 50 MB JSON blob really quickly.
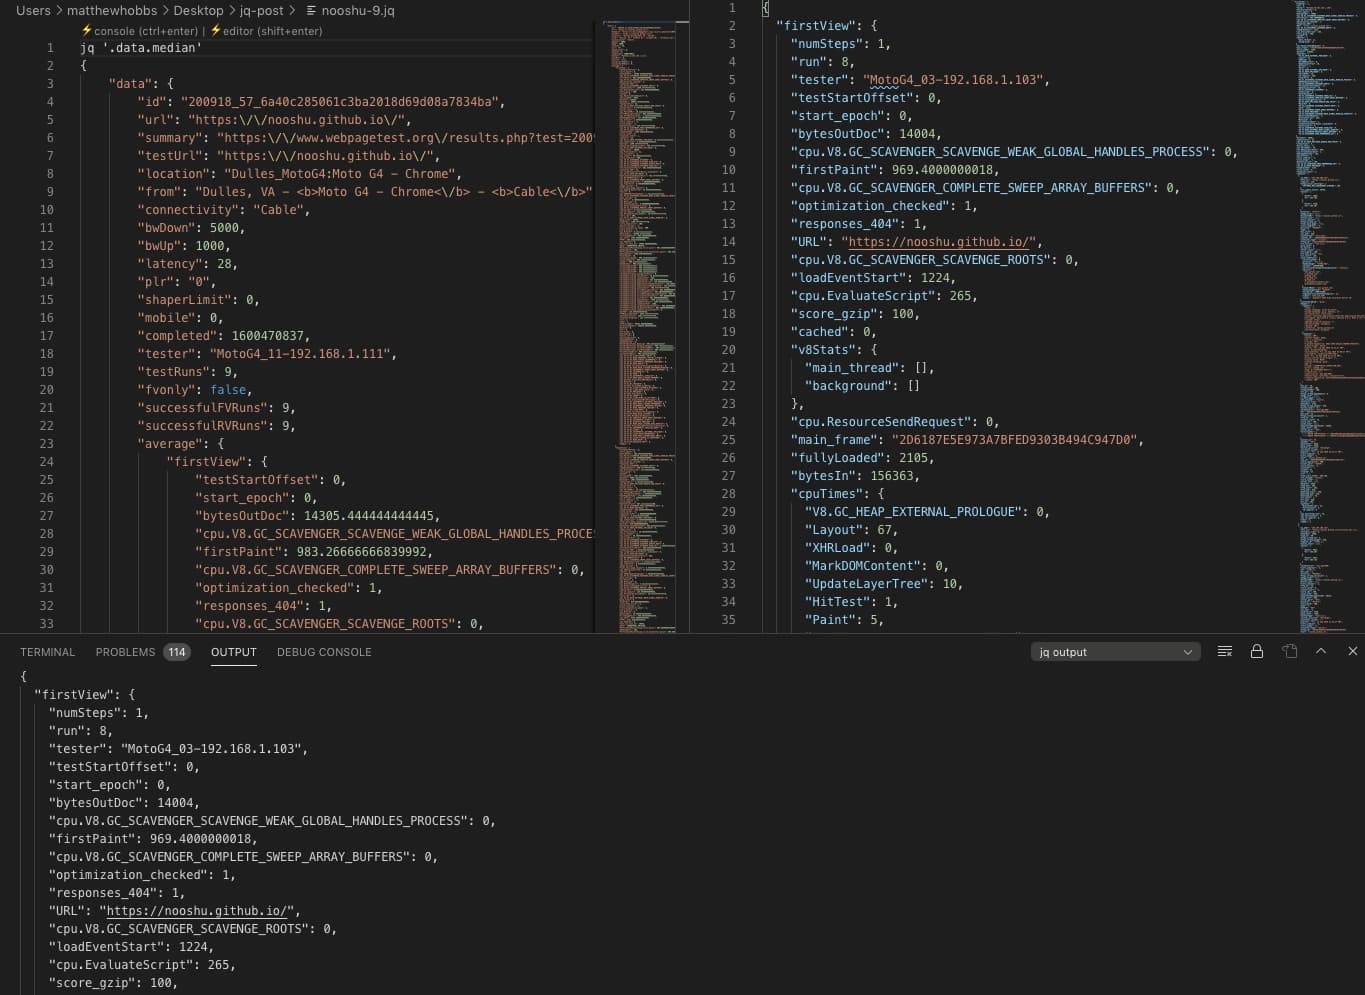
The major downside that I have found with this extension is that it only works on file types with a .jq extension. So when you have a huge JSON blob from WPT, this needs to be renamed to blob.jq. Once done you type your filter directly above the JSON (as seen in the image). You can then show the result in the console, or another editor window. I’m not a fan of both of these workflow requirements. If this extension could be filtered via a separate input box, and it worked on .json files, then this extension would be almost perfect. Find the Visual Code jq playground here.
vscode-jq
At first it took me a little while to figure out how to use this extension as the documentation is non-existent. You need to open the ‘Command Pallet..’ then type >jq, at which point you will be given an empty input box to enter your filter string. Press ‘Enter’ and the result will be displayed in the ‘Output’ panel at the bottom of the window (see image below).

I tested the plugin with very large JSON files, all the way up to 50 MB and it worked perfectly. It was also very quick to return a result considering the size of some of the files. There are a couple of downsides though: The ‘output’ tab at the bottom of the window is very limited in terms of vertical size. And as JSON files tend to spread over thousands of lines this can be quite frustrating. Second, there’s no JSON syntax highlighting in the ‘output’ tab, so it can be quite hard to read the output. And finally, the history of previous filters isn’t saved. Considering the trial and error aspect of jq filters, this is a real shame. Having to retype the whole filter again for a minor change means debugging is slower than it needs to be. All in all, I love the speed and JSON size capacity, it’s just missing a few features from my workflow to be perfect. Find the vscode-jq extension here.
jq Live View
This extension looked really promising. Upon opening a JSON file you get a small ‘jq’ icon in the top right of the window which you click to bring up the filter input. Input your filter, press ‘enter’ and a new file window pops up with the result. It also remembers your history of filters which is a nice touch.
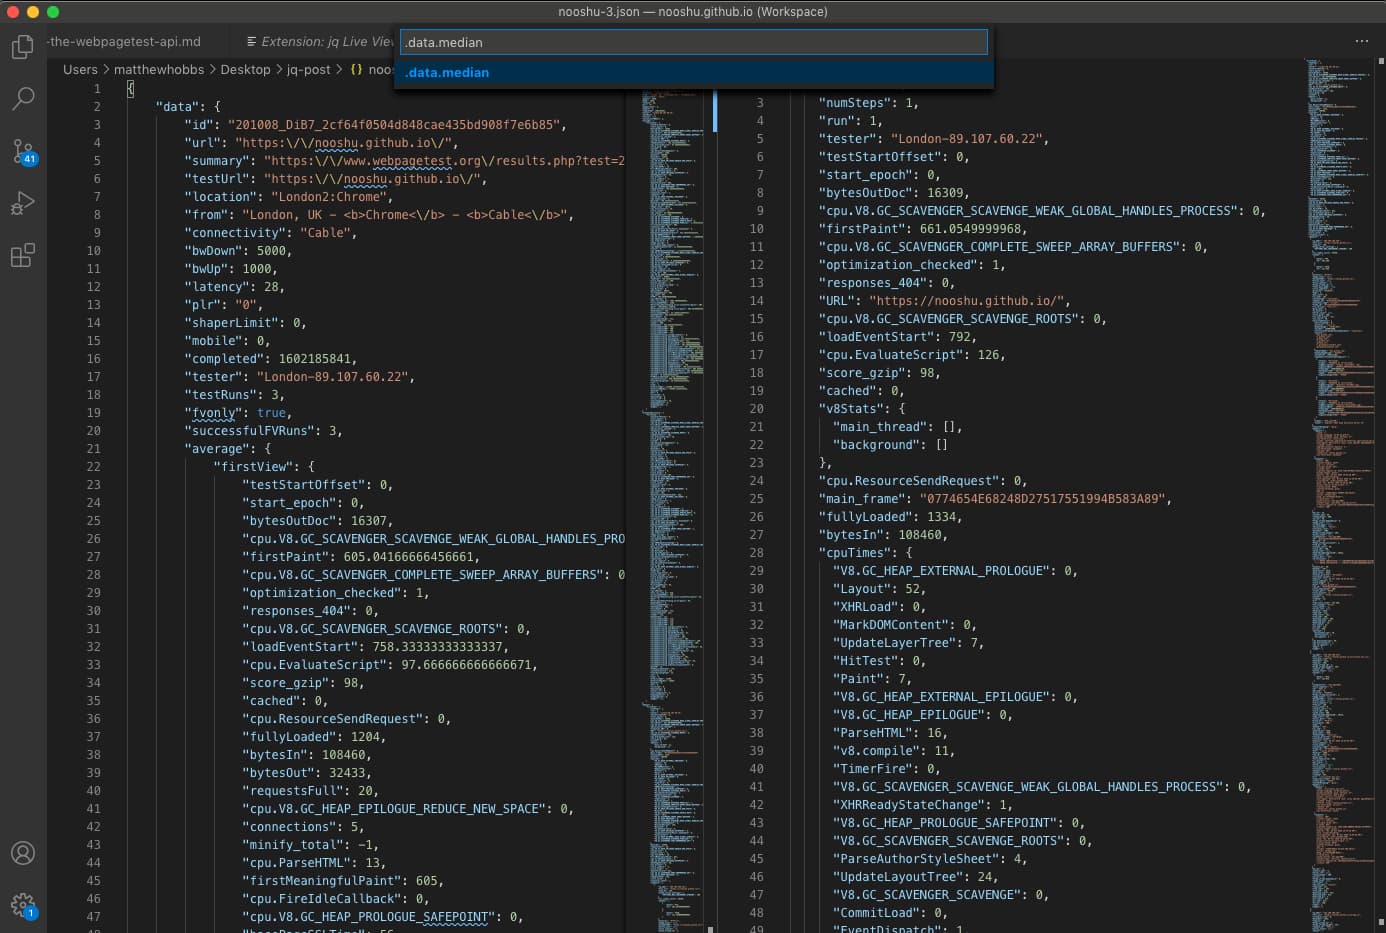
Unfortunately it comes with a major flaw when it comes to working with WebPageTest JSON blobs. I could only get it to work with files that were less than 1 MB in size. The error stdout maxBuffer length exceeded with large files raised its ugly head with files larger than 1 MB. To put that into context, passing this site’s homepage through WebPageTest with 3 runs creates a 950 KB blob (which worked). Upping that to 5 runs creates a 1.4 MB blob (which failed). I’m going to investigate and see if there is a way to fix this issue, as I really like the extension and think it is almost perfect. Quick and easy to use, just not recommended for WPT blobs at the moment! Find the jq Live View extension here.
jq>play - A playground for jq 1.6
To be clear, this isn’t an extension for VS Code, it is a separate website created by the author of jq that allows you to manipulate JSON in (almost) real time. It gives you a number of pointers below the main panels as to what manipulation options are available. But be warned: clicking on one of these will clear your current filter text!
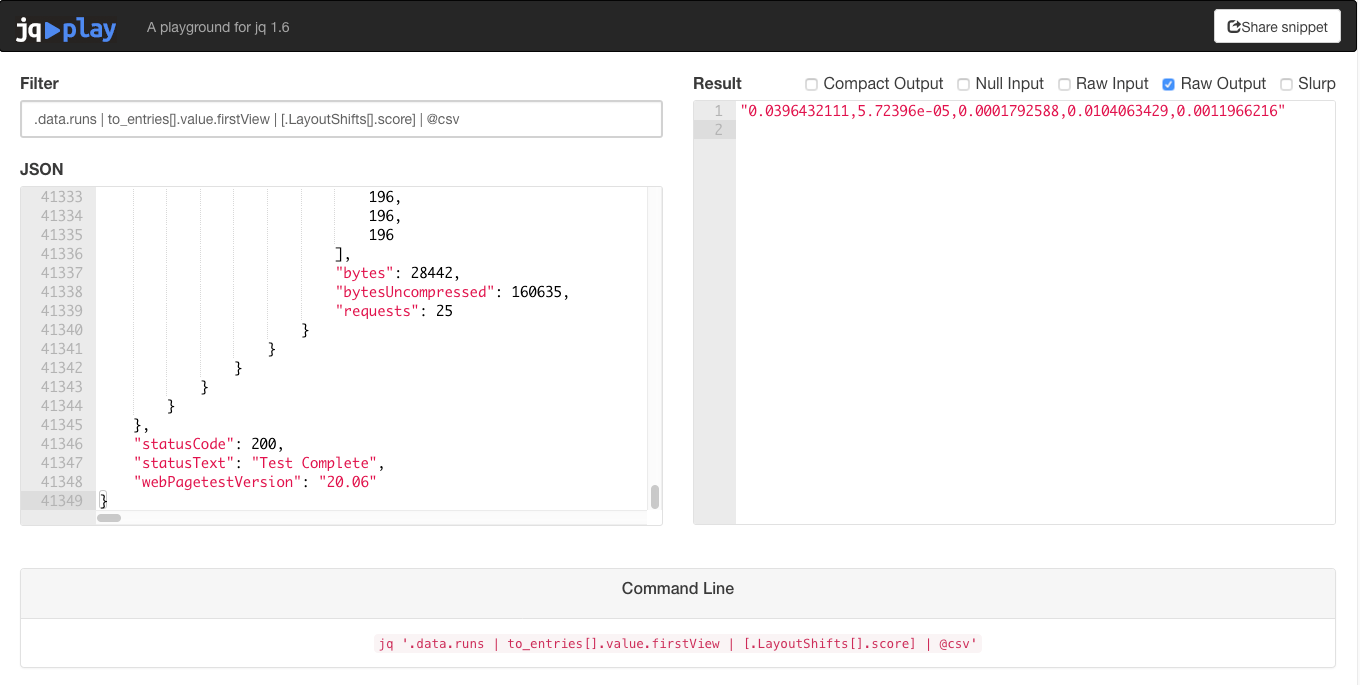
It’s a fantastic website for quickly seeing what a filter does to pasted JSON code. But it does come with a few limitations: The JSON file size limit is 10 MB, so no super massive JSON blobs allowed. There’s also no input delay on the filter input text box, so while you are typing you will likely see compilation errors due to an incomplete filter. This can be very annoying, especially when filtering a large amount of data, as it takes a number of seconds to complete. A setting to toggle this functionality on and off and replace it with a submit button would solve this issue. So if you do decide to use this tool I highly recommend configuring your filter on a JSON blob with a low number of runs first, then transfer this over to the jq command on the command-line.
Conclusion
So in this blog post we’ve looked at the WebPageTest API, figured out how to reduce the amount of data to something more manageable using jq, and looked over a few examples as to how jq can be used to extract specific web performance data for further examination. Finally we looked at a few tools to help with the writing of jq filters when manipulating JSON data. I hope you found this post useful. It really has only scratched the surface of what is possible with jq.
If you have any go to filters of your own, or any feedback on the ones written here please do let me know. Thanks for reading.
Post changelog:
- 09/10/20: Initial post published.
- 09/10/20: Post updated with details about the new
normalizekeys=1parameter Pat Meenan has added to WebPageTest to strip out non-alphanumeric characters from the JSON response. Thanks Pat! - 14/10/20: Added link to the ‘wpt-jq-data-scripts’ repo with all the scripts and more for people to use. Feedback and ideas welcome!
