dat.gui – controller library for JavaScript
Very recently I’ve been looking at some awesome JavaScript experiments and have noticed they are all using the same GUI. Now I fully admit I had a little ‘blonde’ moment as I assumed it was just a style everyone had adopted; developers being ‘one of the cool kids’, that type of thing. It turns out I was wrong, and it finally clicked. All the experiments have started using a little controller library called dat.gui.
After it appeared on Google’s workshop (along with three.js), I thought it was about time I had a play with this neat little library. Luckily there’s an excellent set of documentation and working examples available so you can dive right in. Here’s a code example of how to get started:
1
2
3
4
5
6
7
8
9
10
11
12
13
14
15
16
17
18
19
20
21
22
23
24
25
26
//Define the controller function
var FresnelControls = function() {
    this.movingParticles = 5000;
    this.seedColor = "#ff0098";
};

//Create the Dat.gui controls
var fc = new FresnelControls();

//Create the GUI
var gui = new dat.GUI();

//Add 2 folders
var f1 = gui.addFolder('Particle Dynamics');
var f2 = gui.addFolder('Particle Colours');

//Add the moving particles controller to folder 1
f1.add(fc, 'movingParticles', 0, 5000).step(1);

//Add the colour controller, store in a var to attach events
var seedColor = f2.addColor(fc, 'seedColor');

//Colour change event
seedColor.onChange(function(value) {
    //Do something on color change...
});
I decided to dig out an old demo I created last year and adapt it to use dat.gui. Originally I used jQuery + jQuery UI to control the JavaScript variables. It worked well, but it really added page weight (jQuery + UI came to over 90Kb); not great when you are only using it for the sliders.
Following the documentation you start off simple and progressively add more of the dat.gui functionality. You can see my adapted demo here. The dat.gui code is highlighted if you want to see how it was set up.
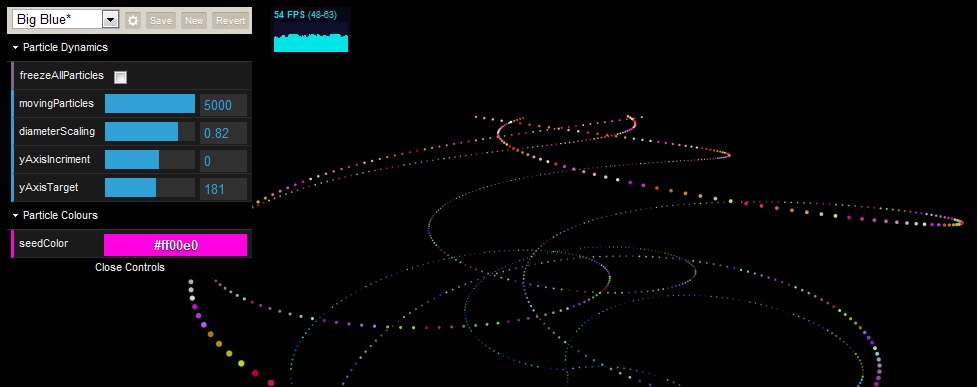
Dat.gui really has some excellent features available. I was able to make use of the colour picker, presets and folder functionality; but there’s a whole host of others I didn’t, such as the custom placement and updating the display automatically. Personally I love the presets functionality; supply the GUI with a little bit of JSON and away you go!
As always, a big thank you goes out to the Data Arts Team in Google’s Creative Lab for creating such a useful little library! One I will be using in every demo I create from now on.