Lighthouse score of 100: not always for the better
Back in December of 2018 I wrote a blog post about joining an entirely made-up club for websites that achieve a score of 100 for performance in Google Lighthouse. So I’m now writing a follow-up post about removing myself from said super-exclusive club. Here’s why.
That warm and fuzzy feeling
Achieving a perfect score, 100/100 is always a good feeling. But you need to be cautious with automated tools like Lighthouse. What you think is the best you can achieve because a set of computer algorithms has crunched the numbers and output a score, may not be the case at all. It’s always a good idea to do some manual checking yourself. After all, computers can sometimes be wrong (shock horror)!
What tools like Lighthouse do really well is identify where you may have potential problems. The low-hanging fruit that go against best practice. If these are fixed it should improve your websites performance. If you are interested in how Lighthouse calculates the scores for each of the audits, you can see it all here in the Lighthouse v5 Score Weighting spreadsheet. Using this spreadsheet you can easily identify where your site is failing to meet the criteria for a certain score and try to improve it. It’s worth noting the weighting attached to each metric too, so you can concentrate on the metric with the most weight (for performance it is Time to Interactive at the time of writing).
A throne of lies!
The above header is very harsh. But it is entirely possible to game the system. Manuel Matuzovic wrote a blog post in May about how to build the most inaccessible website with a perfect Lighthouse score. The basic idea is to make sure you meet the criteria the automated tool is testing for, but implement them entirely incorrectly. The automated test gives you a perfect score (you tick all the boxes after all), but the poor users trying to use the website who are doing your manual testing discover the truth. The throne of lies!
As Manuel mentions in his post, this isn’t an issue at all with Lighthouse. You can do this with many automated testing tools. It’s about us as developers not blindly accepting the results of automated tools. Use them as a guide, but also do some manual testing to make sure you are interpreting the scores correctly.
My issue: Font preloading
Preloading allows a developer to tell a browser there are assets on the page that are very high priority. These assets should be loaded as soon as possible. At some point in the page lifecycle these assets are going to be used, so load them right now. This technique is very often used with WOFF2 webfonts like so:
<link rel="preload" href="/assets/font.woff2" as="font" type="font/woff2" crossorigin>
The font is bumped up the priority list and is loaded immediately after the HTML. Without the preload, the browser needs to download the CSS, parse it, create the CSSOM, and only then the webfont is downloaded. At this point the page is rendered. In theory preloading should be quicker in terms of rendering the font to the page (since the font is already in the cache when it is needed). But preloading has the side-effect of essentially adding bytes to the browsers critical render path, and by doing this you could actually be slowing your page performance down!
So I tested the homepage of this website with and without webfont preloading used.
Results
When auditing a page using Lighthouse it can throttle both the CPU and the network to emulate a mobile device on a slower network. I couldn’t replicate the CPU throttling in Web Page Test, but I could use the same network settings. These are:
- 562.5ms HTTP Round Trip Time (RTT)
- 1,474.6 Kbps download speed
- 675 Kbps upload speed
Although not perfect, this will allow for a closer comparison of the results between Lighthouse and Web Page Test.
Results without font preloading
With font preloading removed the site only gets a score of 99/100 in Lighthouse.
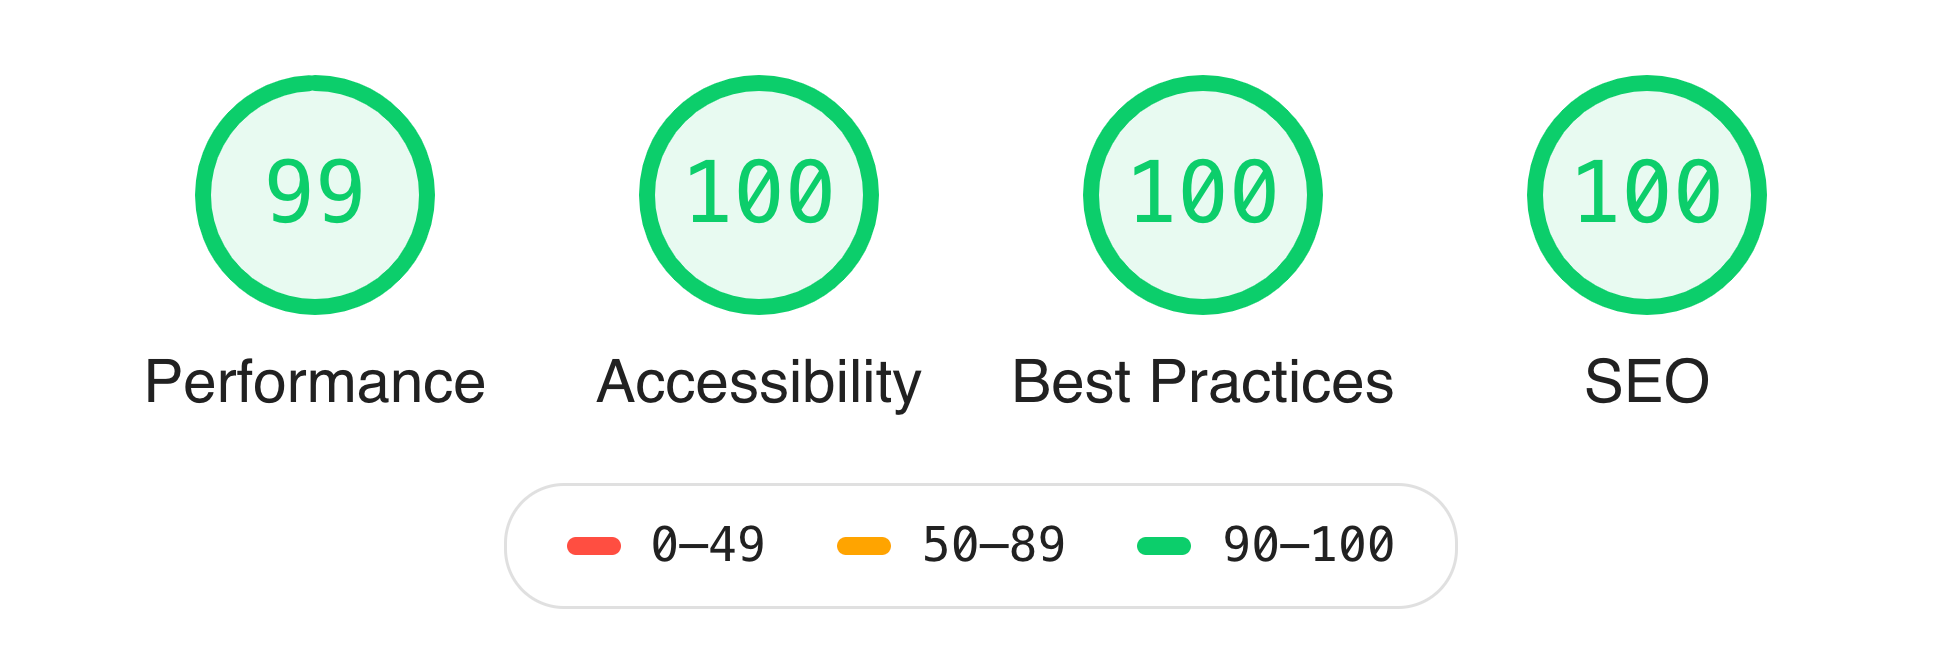
You can see the full results for this audit without font preloading here.
Running the site through Web Page Test you can see where the font would usually be downloaded by the browser (request number 11). After the HTML, CSS and parsing is complete.
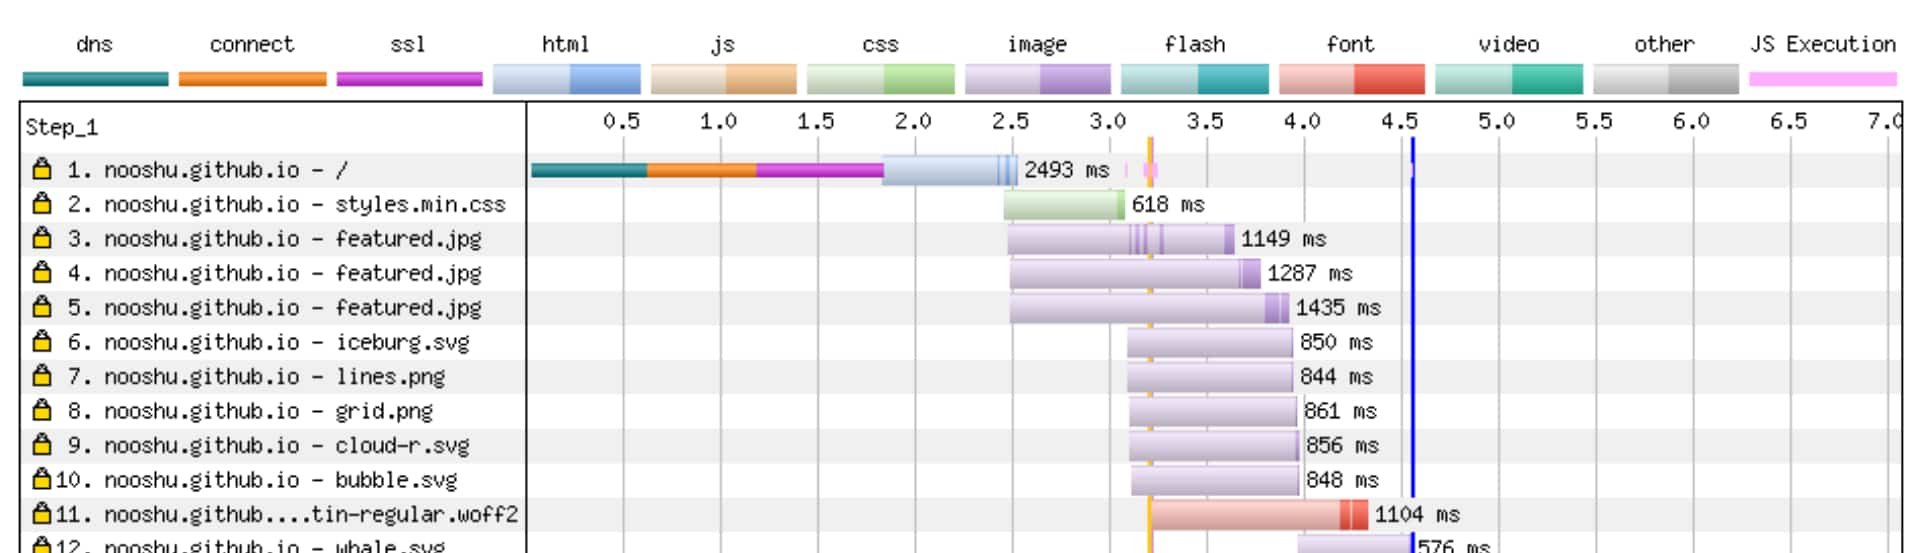
You can see the full results for this Web Page Test without font preloading here.
Results with font preloading
With font preloading the website gets a perfect score of 100/100 for performance in Lighthouse.
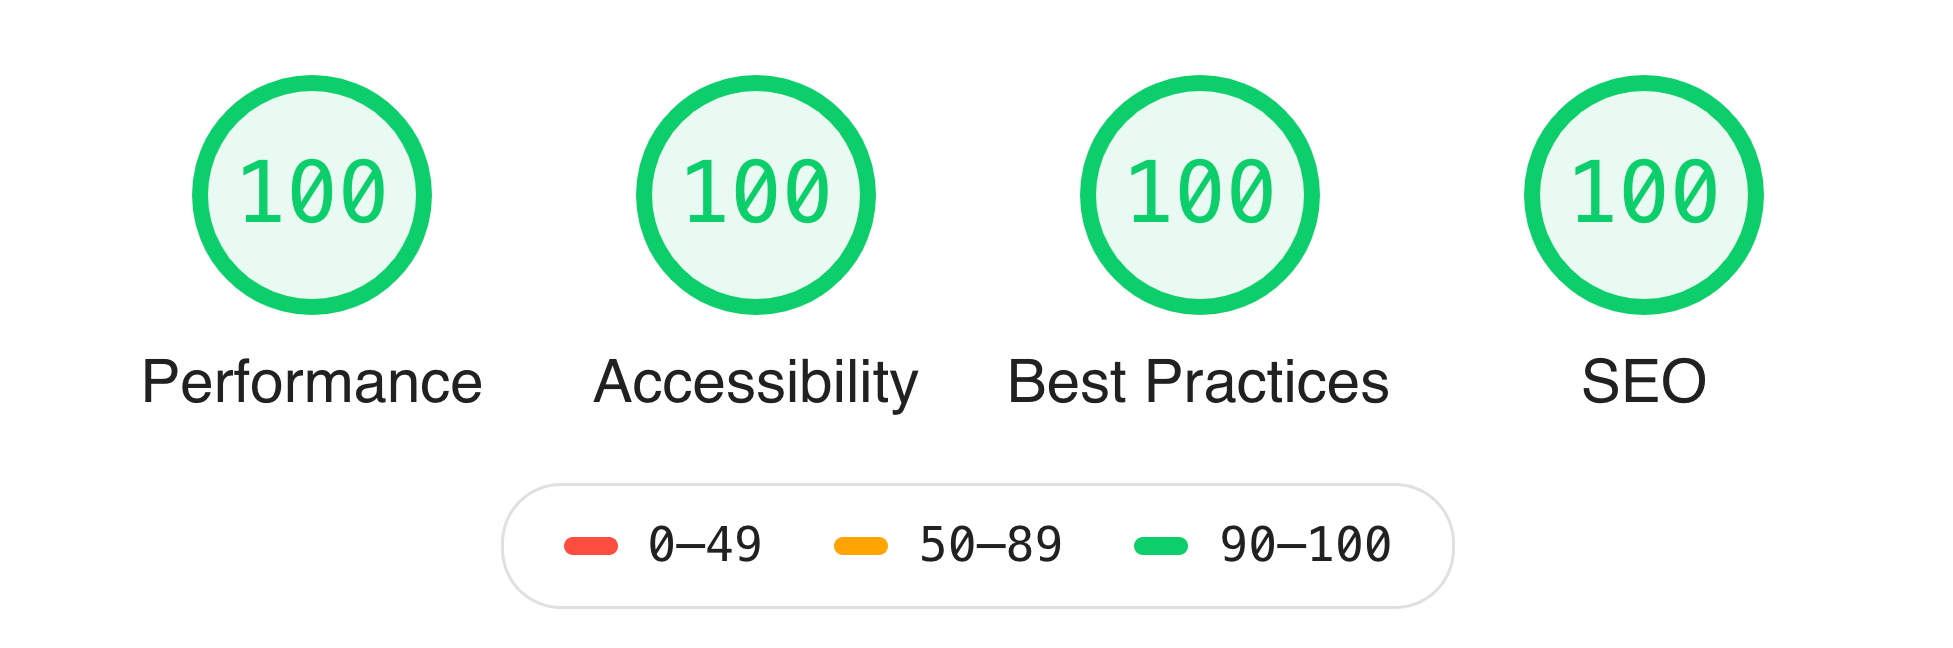
You can see the full results for this audit with font preloading here.
Again, running the site through Web Page Test it is possible to see the font preloading in action. Request number 2 (directly after the HTML has downloaded and parsed), is the font preloading in action.
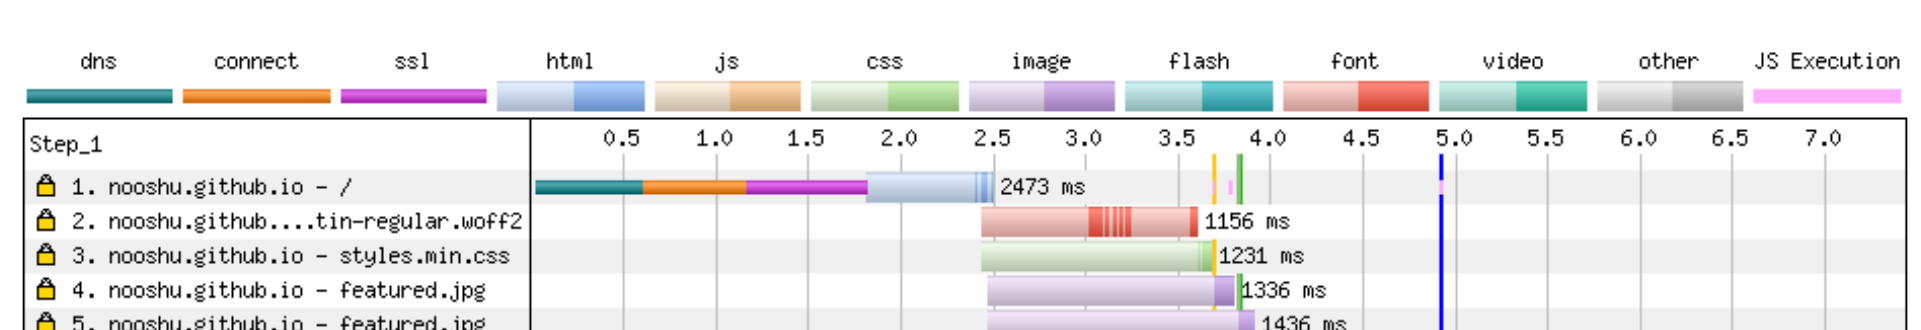
You can see the full results for this Web Page Test with font preloading here.
Comparing results
So lets pull some key metrics out from these tests and compare the results:
| Metric | Without Preload (ms) | With Preload (ms) | diff (%) |
|---|---|---|---|
| Start render | 3200 | 3834 | +19.8 |
| First Contentful Paint | 3199 | 3819 | +19.4 |
| Speed Index | 3411 | 3962 | +16.2 |
| Document complete | 4551 | 4914 | +8.0 |
| Fully Loaded | 7062 | 7422 | +5.1 |
| Visually complete | 7700 | 8200 | +6.5 |
| Lighthouse Score | 99/100 | 100/100 | +1 |
As you can most likely see from the table, all the metrics go up, not down. By preloading the font we’ve actually made page performance worse. The start render time for example is 20% slower (+600ms)!
You can clearly see this in the Web Page Test side-by-side comparison. The filmstrip “without preloading” starts way before “with preloading”. And it is easy to see what is happening if you compare the waterfalls:
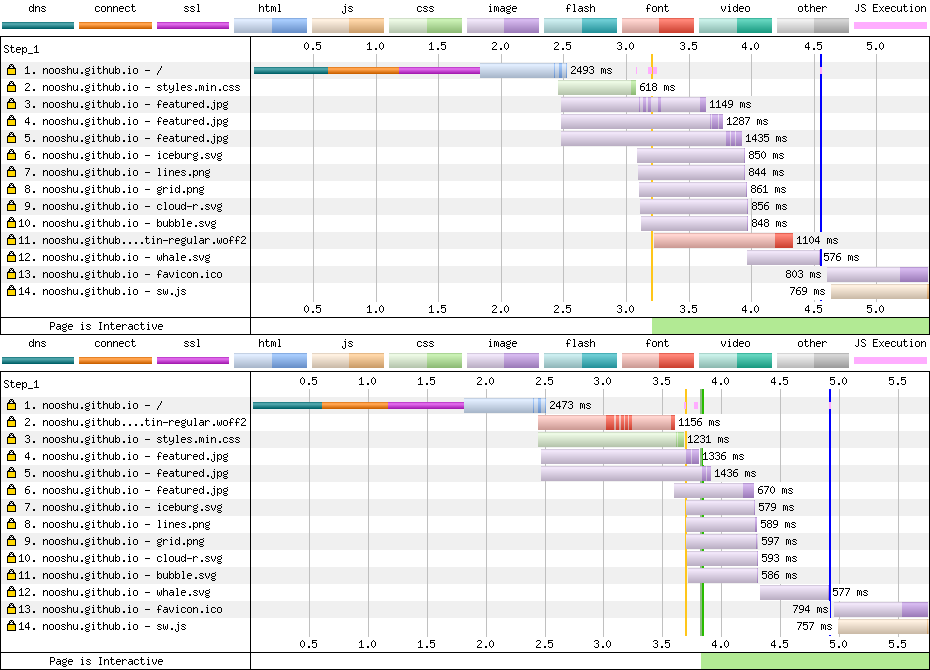
It’s exactly as described above. Preloading the font has added bytes to the critical render path and all other assets have been bumped along the waterfall (requests 6-11). This means the CSS is delayed by approximately 600ms, and all other metrics suffer because of this delay.
Conclusion
So in this particular case, font preloading actually makes performance worse, even though Lighthouse suggests otherwise. Comparing the two audits against the Lighthouse v5 Score Weighting sheet, it looks to lose 1 point because Time to Interactive jumps from 1.7 seconds (preload) to 2.2 seconds (no preload). This pushes it into the “Score of 99” bracket. Since TTI counts for 33.3% of the category weight it makes quite a difference to the overall score. What’s more confusing is Web Page Test suggests the exact opposite. Note the green bar at the bottom of waterfalls (Page is Interactive):
- WPT TTI no preload ~ 3200ms
- WPT TTI with preload ~ 3800ms
- Lighthouse TTI no preload ~ 2200ms
- Lighthouse TTI with preload ~ 1700ms
I’m unsure which value is actually correct in this case. I would lean towards WPT if I were pushed to make a decision. If anyone has any information on what is going on here let me know on Twitter, as I’d love to know!
Since this is all synthetic testing, it’s hard to tell if this is this is true for all devices and connection combinations. RUM testing would give much more information to draw wider conclusions, but that seems a little overkill for my little blog though. So I will be removing font preloading from these pages.
As mentioned earlier, this isn’t an issue in the way that Lighthouse is reporting the score. It’s how the score is being interpreted. It’s important to remember that automated testing tools can only take you so far. Don’t take them as gospel, they aren’t perfect. Use them to check a large number of pages quickly to look for obvious issues. But also remember to do some manual testing too, ideally with users and the devices they use.
